


Options trading can be complex and intimidating, especially for rookie traders. Understanding the technical aspects of trading can help significantly in navigating it. One such facet is technical analysis: chart patterns and indicators used to understand market behaviour that offers insight into what type of option strategy may work best for any given condition. Thus, savvy traders have an advantage as they can recognize these trends more quickly than other investors—and capitalize on them while everyone else plays catch-up.
This article will discuss how understanding technical analysis should be part of any successful options trader’s toolkit—from recognizing chart patterns to analyzing various indicators like momentum and volume. With these tools, you’ll better understand where the markets are headed and how your trades may perform in different scenarios.
Defining Technical Analysis and its Benefits for Options Trading
Technical analysis is a robust tool for evaluating market trends and patterns, applicable in different financial markets such as stocks and options trading. Practitioners and enthusiasts of technical analysis employ mathematical and statistical models to examine past market data and current market behaviour to predict future trends. Technical analysis is crucial in options trading as it offers traders a more nuanced and detailed understanding of market movements.
One significant advantage of technical analysis for options trading is that it allows the trader to make decisions based on reliable data, take advantage of the various trading opportunities and mitigate potential risks. Dubai option trading is no exception – traders in this region can benefit from understanding technical analysis to help them make the most of every trade.
Types of Technical Indicators Used in Options Trading
The most common technical indicators used in options trading are divided into two main categories: trend-following and momentum. Trend-following indicators, such as moving averages and Bollinger bands, measure past prices to anticipate future price movements. On the other hand, momentum indicators like the relative strength index (RSI) and stochastic oscillator offer an understanding of the current market’s direction, which helps traders determine the timing of their trades.
Other popular technical indicators include volume analysis, which gives an idea of whether there is enough liquidity for a trade; support and resistance levels that indicate when a position should be opened or closed; and candlestick patterns that reveal short-term trends in the market. By knowing all these indicators, you can apply them to your options trading strategy and increase the likelihood of successful trades.
Chart Patterns as a Tool for Making Options Trades
Chart patterns provide an in-depth analysis of the direction and momentum of any given security. These patterns, such as double tops and bottoms, ascending and descending triangles, and head-and-shoulders, can be used to identify emerging trends in the market that could be profitable while also providing insight into potential risks. More experienced traders can use information from chart patterns to craft more sophisticated options trading strategies.
You can make better decisions when trading options by correctly interpreting the various chart patterns available for analysis. For example, when there is a double top formation at the end of an upward trend in a stock’s price chart—which signals that the price may soon reverse its upward trajectory—you can then decide if it is wise to enter a put option on that stock, given the current market conditions.
How to Interpret Chart Patterns to Spot Opportunities in the Market
Chart patterns are easy to interpret. However, they require an understanding of the underlying conditions that created them. To identify a viable chart pattern, you must be aware of the market trends and price fluctuations that led to it. For instance, when double bottoms appear in a stock’s chart after its prices have been gradually declining for some time, you can buy a call option before prices rise.
It is also important to note that chart patterns can be reliable indicators of future market movements. However, they should always be supplemented with information such as volume analysis and technical indicators. By combining multiple data sources into your trading decisions, you can better manage risks and maximize opportunities in the options markets.
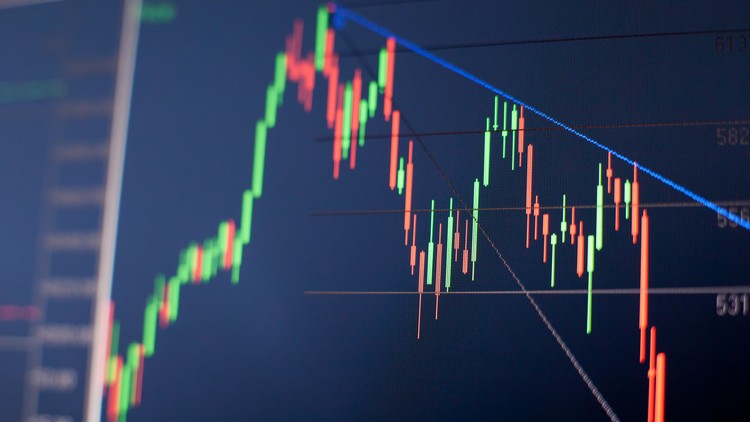
Exploring Candlestick Charts and their Role in Options Trading
Candlestick charts are an essential type of chart that offer a visual representation of the movements in the market. They provide valuable information about the opening and closing prices and the highest and lowest figures for any given period. By studying candlesticks and their patterns, traders can gain insight into potential short-term price swings, which could net them profits from options trading.
For instance, when you observe a long bearish candlestick followed by two or three small bullish candles, this is often an indication that there may be an imminent upwards trend coming up. After considering other factors, such as technical indicators and volume analysis, you can initiate a call option before prices rise again. Candlestick patterns also allow you to identify short-term trends within a given security, which can be used to inform your options trading decisions.


